The A3 diagram
Brief Description:
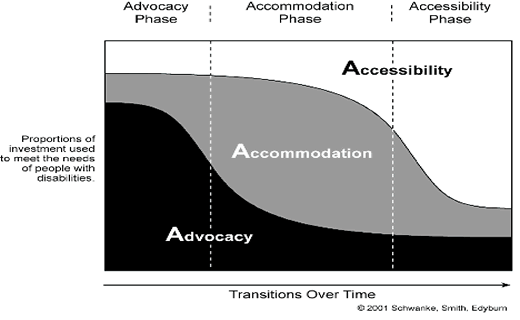
Diagram representing the A3 Theoretical Model.Essential Description:
This graph or diagram serves is a representation of the A3 Model, a theoretical model that demonstrates how organizations provide services for the inclusion of people with disabilities. A progression (over time) is seen with three phases; the first where the organization is using primarily an advocacy approach, then a primarily accommodation approach, and then attending to accessibility of the environment as being the primary approach to including people with disabilites. Each phase includes all three approaches, but in varying amounts, over time, with the optimal phase being accessibility.
Detailed Description:
The diagram shows the theoretical relationships of advocacy, accommodation, and accessibility as approaches to serving people with disabilities over time. The x-axis is labeled “Transition Over Time”. The triptych-like diagram is labeled at the top, from left to right, with "Advocacy", then "Accomodation", then "Accessibility". The y-axis is labeled, “Proportions of investment used to meet the needs of people with disabilities”. The phases are presented with the 3 panels divided by dotted lines. The intervention approach of advocacy is represented as the bottom layer across the diagram in black. The intervention approach of accommodation is represented as the middle layer across the diagram in gray. The intervention approach of accessibility is represented as the top layer across the diagram in white. The diagram looks like a rolling wave.The intervention approaches of advocacy (in black), accommodation (in gray), and accessibility (white) sum to 100% in each of the three parts or phases, depicting the proportional balance of the organization’s approach at any point in time. The left panel shows primarily black then gray in lesser quantity, and then white in even lesser quantity. The middle panel shows the largest portion as gray (or accomodation-based). The right panel shows primarily white space and less of gray and even lesser of black.
Go back